Posted on
January 5, 2015
by
Robert Doolan
B.C. assessments show strong appreciation in Vancouver single-family home values
By Derrick Penner, Vancouver Sun
January 3, 2015
Metro Vancouver homeowners have grown accustomed to healthy increases on their annual B.C. Assessment notices, which are now landing in mailboxes. What’s new this year is that condo values are also rising in the region, after a few flat years that saw condo construction outpace homebuyer demand. “Condominiums, that’s apartments and townhouses, up until 2014 had been relatively flat over three years,” said Cameron Muir, chief economist of the B.C. Real Estate Association. Over 2014, however, Muir said condo sale prices have risen in step with inflation. Condo prices in Vancouver and its nearer suburbs were up about two per cent as of July, when B.C. Assessment sets its values for the next year’s assessment roll. Single-family home values were up a more substantial 6.5 per cent, Muir said, but some of the condo valuations were a departure from the previous year.
“We’re probably looking, in Vancouver, at sales (increases) of 16 to 17 per cent in 2014,” Muir said, “so, there’s much stronger demand, and we’re also seeing inventory levels steadily decline.” B.C. Assessment doesn’t produce average assessment values for property types in Lower Mainland markets but does highlight representative examples.
In Vancouver, a typical east-side two-bedroom apartment increased 4.7 per cent to $381,000, from $364,000 a year earlier. On Vancouver’s west side, values for a typical two-bedroom apartment rose 7.5 per cent (to $616,000), in line with the growth in value of a detached home on a 33-foot lot (up 7.5 per cent to $1.575 million).
In its real estate assessments a year ago, B.C. Assessment had highlighted decreasing condominium values in the range of four to five per cent — the second consecutive year that condo prices declined or offered minimal increases. “Changes within a plus or minus five per cent range, that’s what we categorize as stable,” said Dharmesh Sisodraker, B.C. Assessment’s deputy assessor for the Vancouver Sea to Sky region, which takes in Vancouver and the North Shore all the way to Whistler.
Assessments, which are used by municipalities to set property taxes, tend to lag the overall market by the time they are released. In east Vancouver, a typical detached house on a 33-foot lot saw an increase of 11.3 per cent, to $993,000. In Vancouver Heights, typical detached home prices rose five per cent to $955,000. “(Condominium) prices are still under pressure versus detached homes, mostly because there is so much (condominium) product on the market,” explained Ray Harris, president of the Real Estate Board of Greater Vancouver, and the increases in condo prices are “sporadic.” In Metro Vancouver, demand for new condos has been in high-growth areas linked to rapid transit, such as the Marine Gateway development at Cambie and Marine in Vancouver or the Metrotown and Brentwood town centres in Burnaby. “If a complex is in demand and there are not a lot of units in the market, you can get more of a lift,” Harris said. Suburbs such as Burnaby, Coquitlam and Port Moody — communities either on SkyTrain, or where SkyTrain is being built — are among those that have seen modest increases in the range of two to three per cent. However, the gains weren’t shared equally and some spots still showed decreasing assessment values. B.C. Assessment cited an example at Simon Fraser University’s UniverCity development, where the assessed value of a two-bedroom highrise unit declined 2.5 per cent from 2014. “There are a few pockets where values decreased slightly,” said Zina Weston, a deputy assessor for B.C. Assessment in its North Fraser region, which takes in the eastern suburbs closest to Vancouver. “If there is a lot of building that comes on in a short period of time in a finite area, there might be some (downward) pressure on pricing,” Weston said. Harris added that condo owners trying to re-sell are having a tougher time because developers are selling new units at lower prices than they would be if the market were stronger. Condo values also declined in Fraser Valley suburbs from Langley to Chilliwack, where single-family home prices are in the reach of more buyers. Dan Scarrow, a vice-president at Macdonald Realty in Vancouver, added that some municipalities are more encouraging to condo developers and “as a result of that, maybe some areas tend to get overbuilt.” “Then, in some municipalities, say Vancouver, it is more difficult to get a project off the ground, but demand is actually quite high,” Scarrow added.
Markets that rely on recreational property sales — such as Whistler, the Okanagan and Kootenays, where sales collapsed and values declined following the 2008 recession — also took part in some of the rebound in 2015 assessments. B.C. Assessment cited examples in Kelowna where assessments were up from four to seven per cent. In Whistler, a typical home in the White Gold area increased in value 7.4 per cent, to $1.06 million.
depenner@vancouversun.com
Twitter.com/derrickpenner
Homeowners can look up their assessments on the B.C. Assessment website.
Read more: http://www.vancouversun.com/business/assessments+show+strong+appreciation+Vancouver+single+family+home+values/10697150/story.html#ixzz3NzpvpxlN
Posted on
December 8, 2014
by
Robert Doolan
08 Dec 2014
by Olivia D'Orazio
REP - Real Estate Professional Magazine
Housing starts across Canada remained flat year over year in November, although seasonally-adjusted numbers point to growing momentum in British Columbia and Quebec as developers ramp up to meet immigration demands.
“The trend essentially held steady for a third consecutive month in November,” said Bob Dugan, CMHC’s chief economist, in releasing November numbers Monday. “This is in line with our expectations for 2014, of a stable national picture with new home building concentrated in multiple starts, particularly in Quebec, British Columbia and Ontario.”
Seasonally adjusted starts in November climbed 6.5 per cent month-over-month to 195,620 units. More than half of those starts were multi-unit properties in urban centres, led largely by Ontario and Quebec, though British Columbia posted the largest gains – 26.7 per cent – from October.
It’s important to note, say analysts, that starts were flat from the year-ago period.
While reports suggested overbuilding would become a problem for Canada’s major urban centres, CMHC said more housing is needed to fill the demand created by healthy immigration.
“Ask any real estate developer in any of Canada's major cities about the risk of overbuilding, and the first line of defense would be immigration and its critical role in supporting demand,” said Benjamin Tal, CIBC’s deputy chief economist. “It turns out that, at least for now, this claim is more valid than widely believed.”
New immigrants account for 70 per cent of the increase in Canada’s population. Half of these new immigrants are aged between 25 and 44, representing the country’s economic engine, according to CMHC’s 2014 Canadian Housing Observer.
Article courtesy of REP - Real Estate Professional Magazine
Posted on
December 5, 2014
by
Robert Doolan
Quarterly Population Highlights - BC and Canada
A release from the Province of British Columbia’s central statistical agency
REFERENCE DATE: JULY 1, 2014 | ISSUE #14-02
B.C. HIGHLIGHTS:
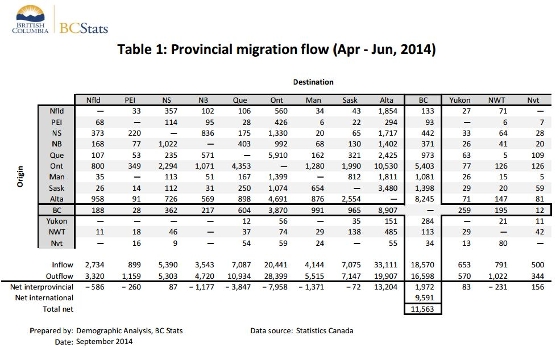
British Columbia’s population was estimated at 4,631,302 as of July 1, 2014, growing by 14,676 persons in the second quarter of 2014 (an increase of 0.3% compared to the first quarter of 2014). Combined net migration from all sources (interprovincial and international) was 11,563. Net interprovincial in-migration totalled 1,972 persons in this
quarter, an increase from the first quarter of 2014. Net international migration accounted for over 65% of the
second quarter gain. The other major component of population growth was a natural increase (births minus
deaths) of 3,113 which accounted for 21% of second quarter growth.
B.C. Population April 1, 2014 4,616,626
Interprovincial migration + 1,972
Add interprovincial arrivals + 18,570
Minus interprovincial exits − 16,598
International migration + 9,591
Add immigrants + 9,917
Minus total net emigrants − 2,414
Net change in non-permanent residents + 2,088
Natural increase + 3,113
Add births + 11,107
Minus deaths − 7,994
B.C. Population July 1, 2014 = 4,631,302
THE LAST TWELVE MONTHS:
B.C.’s total population increase over the twelve months ending July 1, 2014 was 48,677 persons (+1.1%), largely
due to international migration. Immigrants (+37,451) and non-permanent residents (+11,407) continue to be steady
providers of population growth for the province. Interprovincial migration accounted for a net gain of 2,267
persons from July 1, 2013 to July 1, 2014. Total net migration accounted for nearly 78% (+37,906) of the
population growth since July 1, 2013. The remainder was due to the natural increase (+22%; +10,771).
NATIONAL OVERVIEW:
The population of Canada grew by 124,240 persons (+0.35%) to 35,540,419 during the second quarter of 2014.
Leading the growth at the provincial and territorial level were Nunavut (+0.92%), Alberta (+0.86%), and Yukon (+0.79%) followed by Saskatchewan (+0.47%) and Manitoba (+0.43%). The population of British Columbia, Prince
Edward Island, Ontario, Quebec and Nova Scotia reported small gains. The remaining provinces and territories saw population declines.
SECOND QUARTER INTERNATIONAL MIGRATION:
Second quarter net international in-migration increased slightly from the previous quarter to 9,591 from 8,691. This is due mostly to fewer persons leaving for international destinations. More than nine thousand persons (+9,917) immigrated to British Columbia during the second quarter of 2014, offset by about 2,414 persons who emigrated. The net change in nonpermanent residents (NPRs) was +2,088 from April 1, 2014 to July 1, 2014.
SECOND QUARTER INTERPROVINCIAL MIGRATION:
British Columbia was one of five provinces that reported a net gain in population (+1,972) from other Canadian jurisdictions in the second quarter. In B.C. an inflow of 18,570 persons was offset by an outflow of 16,598. British Columbia’s net exchange with Alberta was negative with an estimated 662 more persons leaving B.C. for Alberta than coming to British Columbia. Conversely, net migration from Ontario (+1,533), Saskatchewan (+433) and Manitoba (+90) to B.C. was positive. Alberta was the biggest net recipient province in the second quarter of 2014 with a net gain of 13,204 persons, followed by B.C. with a net gain of 1,972. Nunavut, with a net inflow of 156 persons, Nova Scotia (+87) and Yukon (+83) were the only other areas to post a net gain in interprovincial migrants.
Click here for full report
Posted on
December 3, 2014
by
Robert Doolan

November 25, 2014
Article courtesy of OPP-connect.com
With numbers of non-permanent residents underestimated by around 100,000, demand is being boosted in housing and rental markets in Canadian cities, says a new report from the CIBC bank
Immigration numbers in Canada have been underestimated by around 100,000 and the sector is playing a greater role in supporting the housing market in some of its largest cities, a leading bank believes.
Non-permanent residents — students, temporary workers and humanitarian refugees who are currently residing in Canada – play a key role in demand for new housing and in the rental market, particularly in Toronto, Vancouver and Calgary, says the CIBC’s latest Economic Insights report.
A “huge gap” in the official numbers for non-permanent residents from Statistics Canada’s census data and Citizen and Immigration Canada (CIC), means that household growth projections have been understated.
Benjamin Tal, CIBC Deputy Chief Economist, who co-authored the report with Nick Exarhos, says, “Ask any real estate developer in any of Canada’s major cities about the risk of overbuilding, and the first line of defence would be immigration and its critical role in supporting demand. It turns out that at least for now, this claim is more valid than widely believed.
“Not only has the rising share of young immigrants lifted demand for housing, but also, official population projections understate the actual number of non-permanent residents in the country by close to 100,000,” he says.
New immigrants make up 70% of the increase in Canada’s population and as half are aged 25-44, they represent the country’s economic engine with the highest employment levels and the most likelihood of starting families, the report says.
In 2013, non-permanent residents (NPRs) rose 22,000 to 774,000, with an annual flow equivalent to a record-high 30% of new immigrants the country gets each year.
The number of Canadians aged 20-44 rose by 1.1% in 2013, the fastest pace in more than two decades and almost double the Organisation of Economic Co-operation and Development’s growth rate.
Over the past decade, the number of Canadians in this age group has risen 75% faster than in the United States and that is boosting the real estate sector. “Healthier demographics are benefitting trends in household formation,” says Mr Tal.
Despite some concerns of overbuilding in the current housing boom, the ratio of housing starts to household formation – the rate at which people move – is not far from its long-term average of 1.03, indicating no signs of froth.
“The broadly in line aggregate trend in Canada’s homebuilding means that eventual wind down in the current boom won’t have to be as dramatic as feared by some.”
After a hot housing market in 2011 and 2012, condo construction in Toronto has cooled off, while the trend in Vancouver has been broadly flat for the past four years. Only in Calgary do starts continue to show upward momentum. But because those three cities take in roughly half of all new immigrants, they are also benefiting disproportionately from their presence.
The discrepancy in the immigration figures stem from the fact that many researchers use the 2011 census to project household formation, but the census data suggests non-permanent residents in 2011 was close to 400,000 – more than 200,000 below the figures reported by CIC.
Another widely used measure of household formation is Canadian Mortgage and Housing Corporation’sLong-Term Household Growth Projections – 2013 Update, which is based on Statistics Canada’s 2010 population projection, and underestimated the pace of the increase in the number of non-permanent residents, mainly after 2012.
CIBC economists estimate that in 2014 the official population projection undercounts the number of NPRs by close to 100,000. This has important implications regarding the understanding of the pace of growth in household formation in Canada, says Mr Tal.
“The gap is increasingly becoming more relevant for housing demand since a growing proportion of non-permanent residents come from workers and students with a relatively higher propensity to rent.”
The ‘echo generation’ – the children of baby boomers – are buying fewer homes and with foreign workers set to face more barriers to come to Canada, the demand for new housing is likely to slow in future, although it will be partly offset by the country’s plan to raise the immigration quota by 20,000-30,000 a year, with an increased focus on labour market needs.
CIBC, which is Canada’s largest bank, says while it still sees some moderation in the growth of homebuilding, it expects an average rate of 190,000 starts per year up to 2016, more than 10,000 higher than its previous prediction.
By Adrian Bishop, Editor, OPP Connect
Twitter: @opp_connect
Click here for full article courtesy of OPP Connect
Posted on
December 1, 2014
by
Robert Doolan
Mother Nature is promising to play favourites with agents on one side of the country, as seasonal forecasts predict buyer-friendly winter weather in one key market.
While many Canadian agents are preparing to hibernate through another brutal winter – and slow housing market – industry players in British Columbia are gearing up for another year of warmer-than-normal temperatures, lending to a continued upswing in foreign buyers.
“I think [the strong market] is a reflection, some of it, of the Asian market,” says Helen Wong, an agent in Vancouver, pointing to May, June and October as the busiest months in her real estate calendar. “They have their international holidays – New Years, there is a big holiday in May and in October, so [buyers] come over then. That has a little bearing on [the market]. Then, of course, the normal spring market, which is usually the best market.”
Wong says these foreign buyers, especially those from Asian countries, typically make big spends during these times, bolstering an already active housing market in cities like Vancouver. That only works to accentuate the traditional housing cycle, which shows a healthier market in the warmer months.
According to data from the Canadian Real Estate Association, actual sales are traditionally strongest in May – mainly due to the warmer weather, though seasonally adjusted sales suggest strength in August, before the start of a new school year, giving families plenty of time to settle into a new neighbourhood and new school district.
This winter, though, agents like Wong will be focused more on the local market – especially considering foreigners know enough about Canada to stay away during the winter.
“I’m reactive rather than proactive, so I work with whatever comes my way,” Wong says. “Outside [those busy] months, I work with my local market more – my past clients, my buyers or sellers or empty nesters, or their kids. My offshore market is usually the Asian market, so they come, they look, they buy and they leave. They might refer their friends but they won’t buy again.”
by Olivia D'Orazio
Real Estate Professional Magazine article
26 Nov 2014
Posted on
September 20, 2013
by
Robert Doolan
Posted on
September 20, 2013
by
Robert Doolan
Posted on
September 20, 2013
by
Robert Doolan
News Release
Fraser Valley Real Estate Board
For Immediate Release: Sept. 4, 2013
Click here for full statistics package
Continued improvementin Fraser Valley’s housing market
SURREY, BC – Buyers and sellers continued to show greater confidence in themarketlastmonth as home sales on the Fraser Valley Real Estate Board’s Multiple Listing Service® (MLS®) edged closerto typical levels. The Board processed 1,258 salesin August, an increase of 17 per cent compared to the 1,073 salesin August of last year however,the volume remains 13 per cent below the 10‐year average forthemonth. Ron Todson, President ofthe Board, explains, “The best way to describe ourmarket currently is one of continued,
modestimprovement as buyers and sellers becomemore confident. “In the lastmonth in the Fraser Valley, we’ve seen an increase in sellers willing to accept an offersubjectto anothersale, we’re seeing fewer deals collapse and we’re seeingmoremove‐up buyers, eitherimproving on the size or quality oftheir existing home. These are all indicators of a return to amore typical,stablemarket.” In terms ofinventory,the Board received 2,353 new listingsin August, a decrease of 2 per cent compared to the 2,406 new listingsreceived during the samemonth last year – leaving the volume of active properties at 10,127 a decrease of 2 per cent compared to August 2012.
Todson says, “An importantmeasure ofthe balance between housing supply and demand isthe number ofmonths
it would take to sell our existing inventory.We’re currently sitting at eightmonths’supply in the Fraser Valley, indicating a balancedmarket, which is also being reflected in the stability of home prices. “Home prices generally remain unchanged or down slightly froma year ago; however, do check with your local REALTOR® if you’re in need ofspecific values because the range between property type and community can be sizeable.”
In August,the benchmark price ofsingle family detached homesin the Fraser Valley was $551,000, virtually on par
with $551,400 during the samemonth last year. Fortownhouses,the benchmark price was $298,200, a decrease
of 1.6 per cent compared to $303,000 in August 2012 and the benchmark price of apartments was $203,900, 1.3
per centlessthan in August 2012 when it was $206,600.
|


